
? Updated: 05/02/2025
? By Elliott Wave Insights
The Principles Behind Elliott Waves Explained
📖 Introduction
Ever wondered why markets move in cycles? 🔄
Elliott Wave Theory provides a framework to understand market structure based on investor psychology, trends, and corrections. This guide explains the five-wave impulse pattern and the three-wave corrective structure, helping you apply these principles for better trading decisions.
✔️ By the end of this guide, you’ll learn:
- 📈 How Elliott Waves explain price movements
- 🌊 The 5-wave & 3-wave structures
- 🎯 How to apply Elliott Wave Theory in trading strategies
🌊 What is Elliott Wave Theory?
At its core, Elliott Wave Theory is a technical analysis method used to identify recurring market cycles and predict market trends.
🧠 Developed by Ralph Nelson Elliott in the 1930s, this theory suggests that market trends repeat due to investor sentiment, optimism, and fear.
Price movements follow two distinct wave types:
- 📈 Impulse Waves: Trending moves
- 🔄 Corrective Waves: Counter-trend moves
🔍 The Core Principles of Elliott Waves
Elliott discovered that markets don’t move randomly but follow structured wave cycles.
Each market cycle consists of:
- 📈 A five-wave impulse move (trending phase)
- 🔄 A three-wave corrective move (counter-trend phase)
These phases repeat across different timeframes, from short-term intraday charts to long-term market trends.

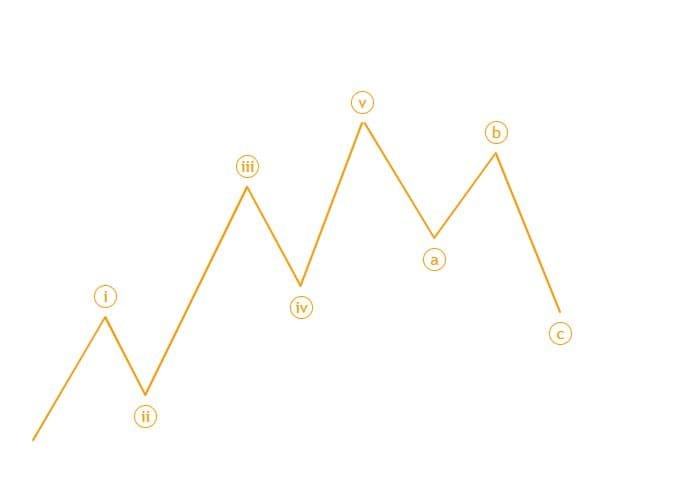
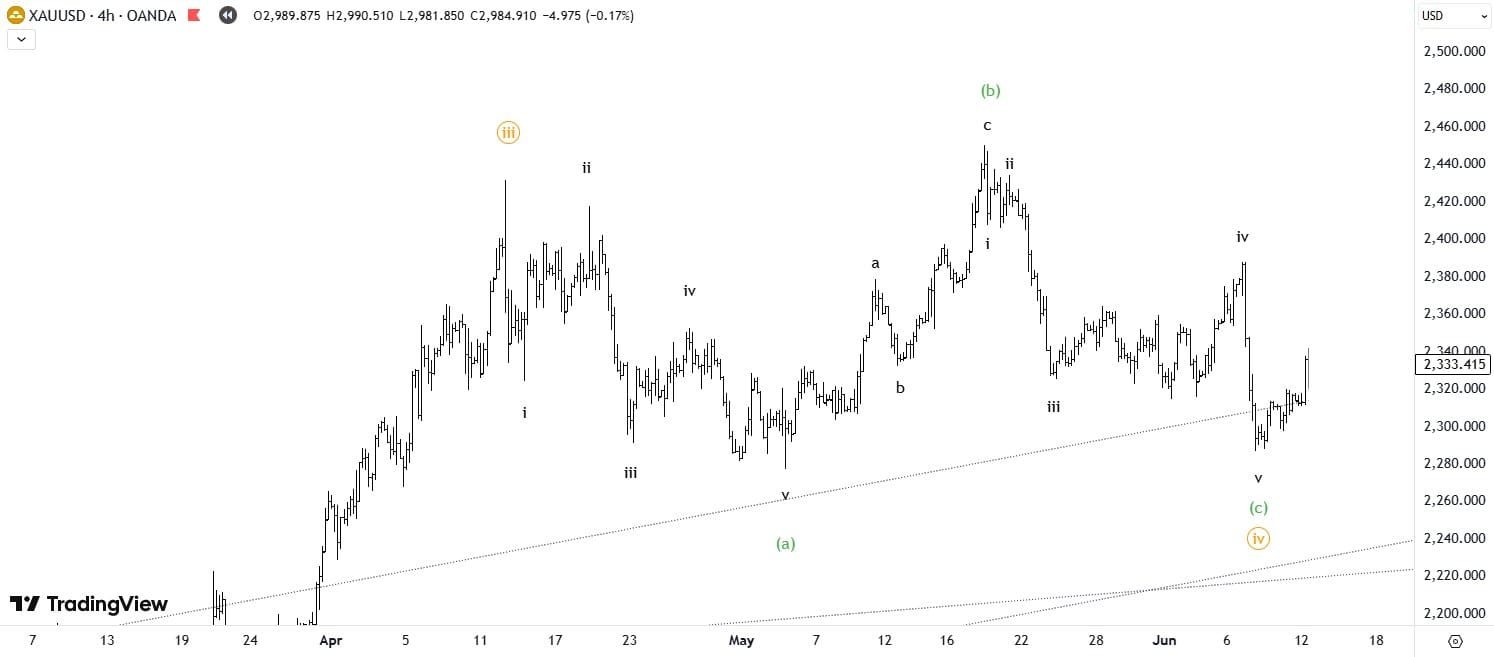
📊 The Five-Wave Impulse Pattern (1, 2, 3, 4, 5)
Impulse waves follow the market trend and consist of 5 waves:
- Wave 1: Initial move as early investors enter the trend.
- Wave 2: A pullback to test previous support levels.
- Wave 3: The longest and strongest wave as momentum strengthens.
- Wave 4: Consolidation phase before the final push.
- Wave 5: Final effort before a significant correction.
🔥 Pro Tip: Wave 3 is usually the longest and most profitable wave.
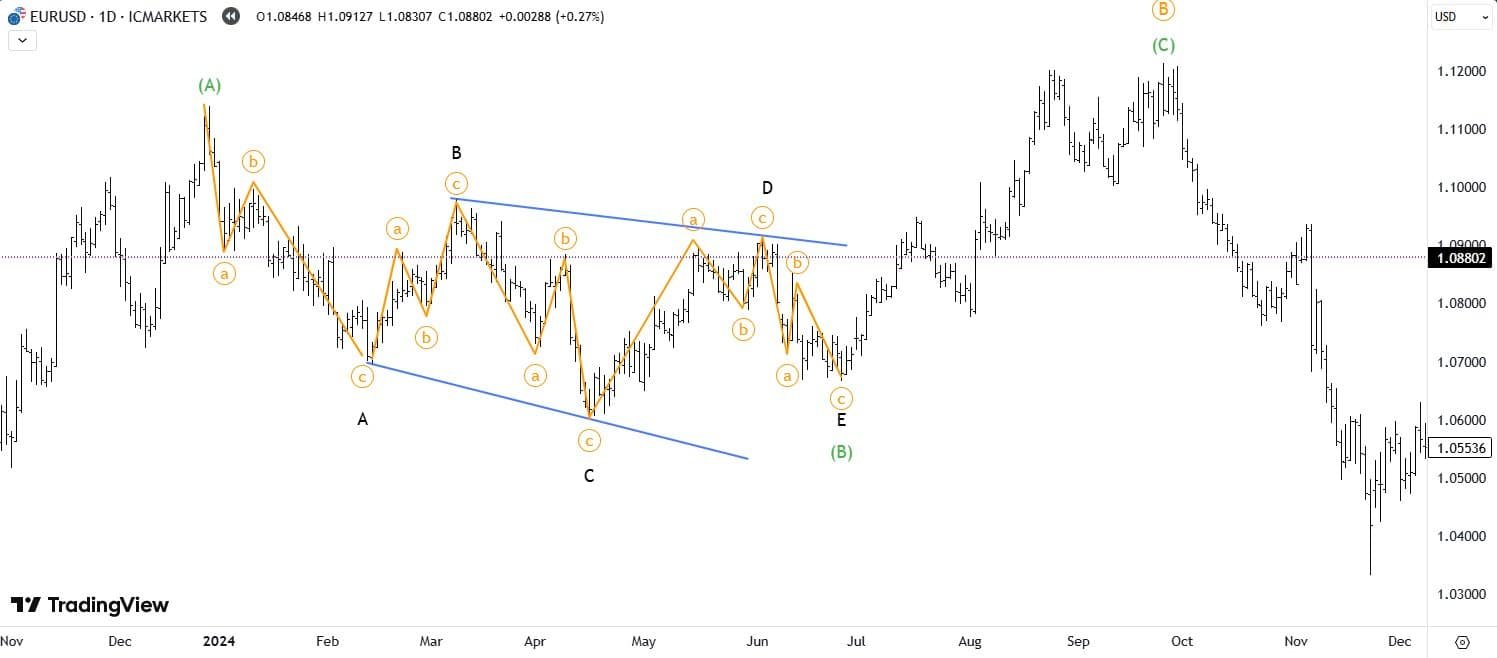
🔄 The Three-Wave Corrective Structure (A, B, C)
After an impulse, the market usually corrects with a three-wave pattern:
- Wave A: The first move against the prevailing trend.
- Wave B: Temporary retracement.
- Wave C: Final leg completing the correction.
These corrections often appear as:
- 🔺 Zigzag Patterns (5-3-5)
- 🔳 Flat Corrections (3-3-5)
- 🔻 Triangle Consolidations (A-B-C-D-E)
Zigzag (5-3-5)
Flat (3-3-5)
Triangle (A-B-C-D-E)
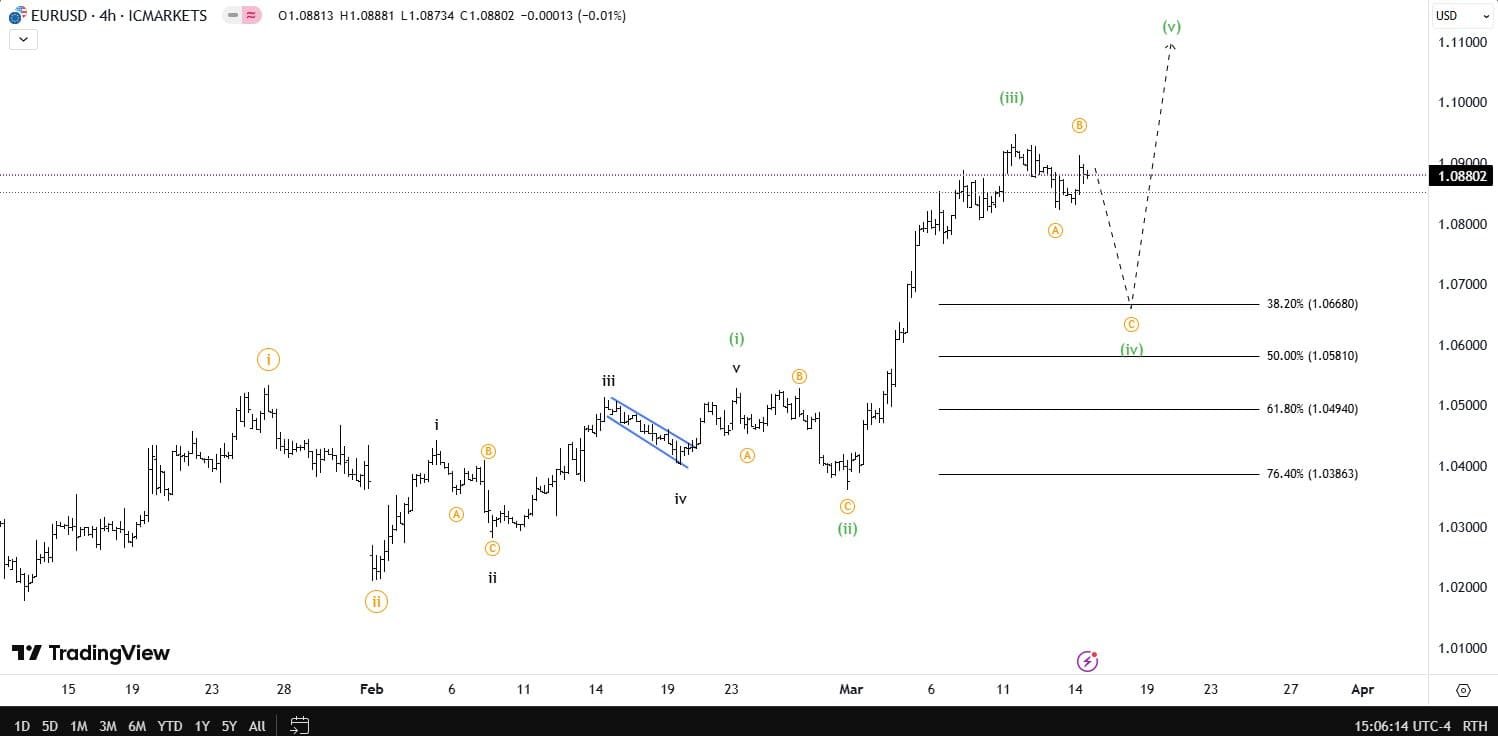
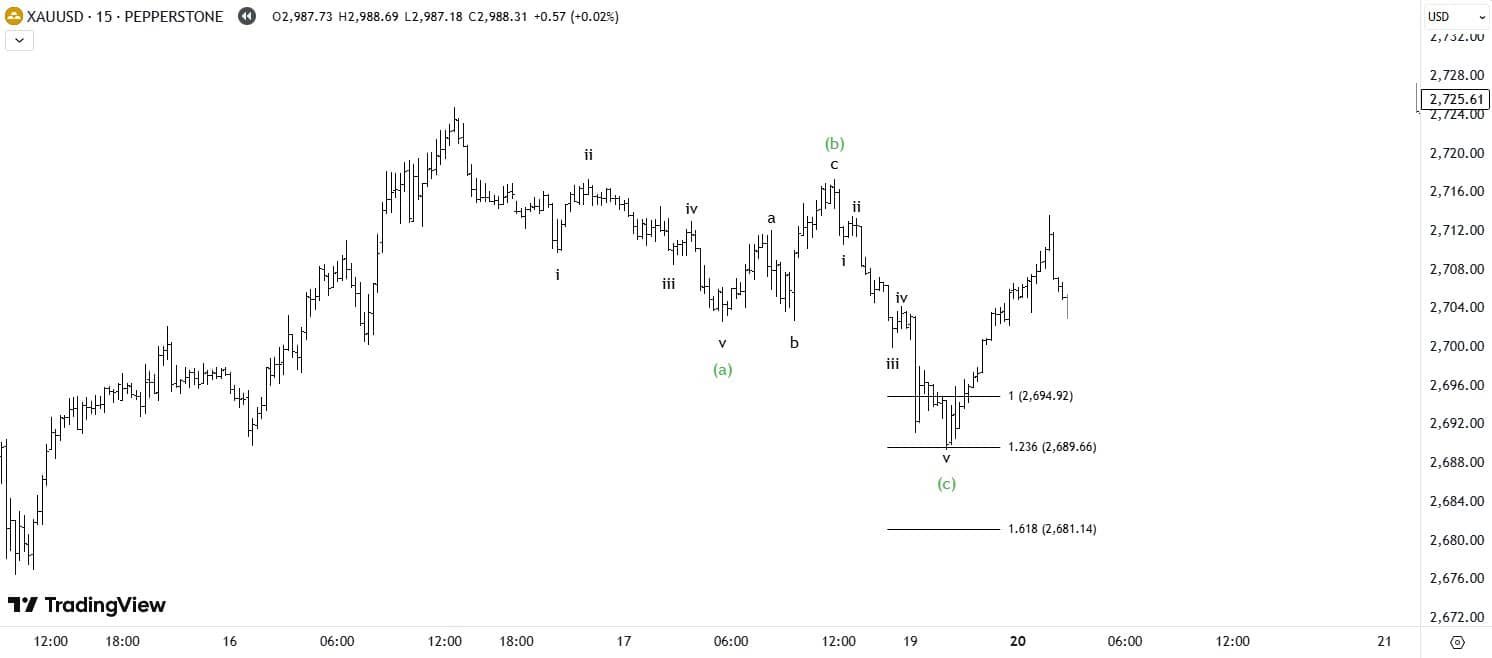
🎯 How to Apply Elliott Wave Theory in Forex Trading
Applying Elliott Wave principles in trading can help:
- 📊 Predict market trends & reversals
- 💡 Identify high-probability entry & exit points
- 🎯 Improve risk management strategies
✅ 3 Steps to Using Elliott Waves in Trading
1️⃣ Identify Market Waves
- Use charting platforms like TradingView to label wave structures accurately.
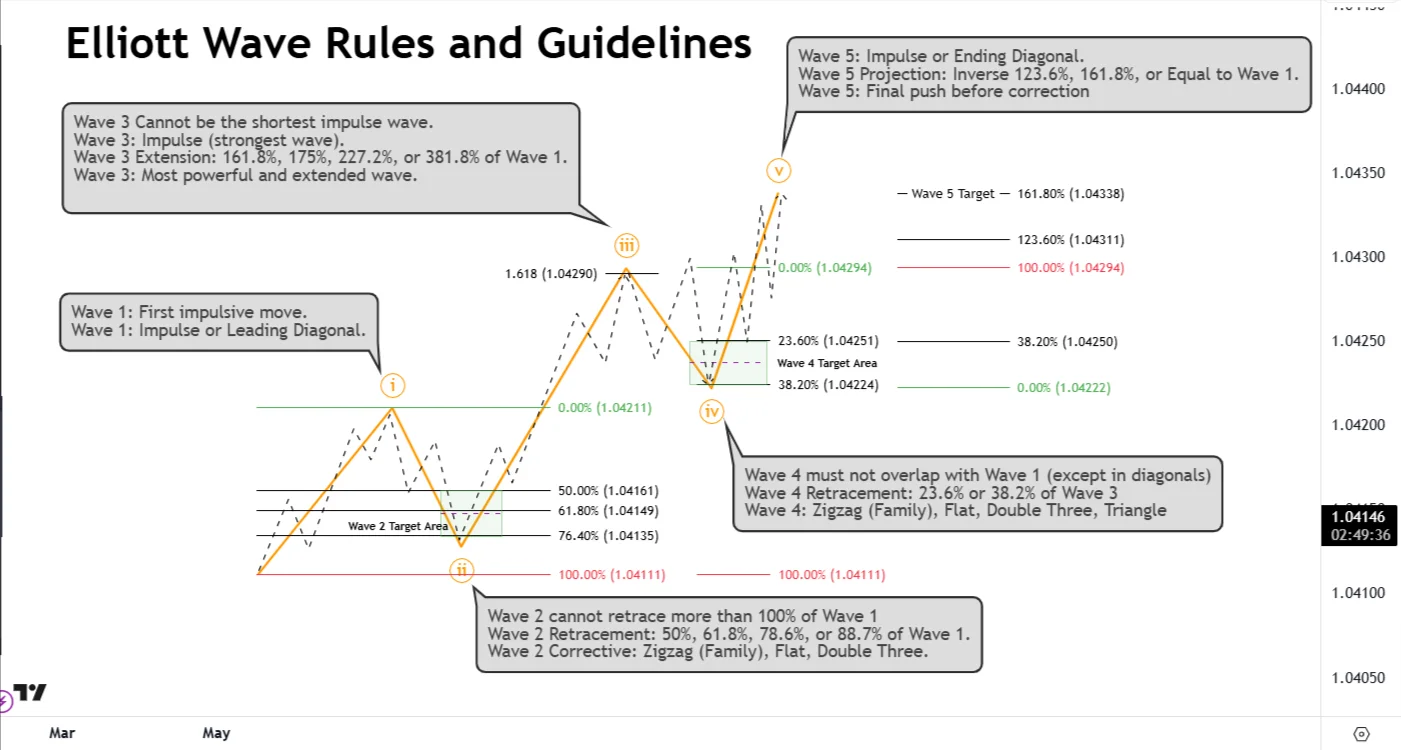
2️⃣ Combine with Fibonacci Retracements
- 📉 Wave 2 typically retraces 50%, 61.8%, or 78.6% of Wave 1.
- 📈 Wave 3 often extends 161.8% of Wave 1.
3️⃣ Confirm with Indicators (RSI & MACD)
- Use momentum indicators to validate wave strength and reversals.
🚩 Common Elliott Wave Mistakes to Avoid
❌ Forcing wave counts – If the structure doesn’t fit, don’t force it.
❌ Ignoring Wave 3 rules – Wave 3 must not be the shortest impulse wave.
❌ Misidentifying corrective patterns – A flat vs. a zigzag can affect trade direction.
🏁 Final Thoughts & Next Steps
Elliott Wave Theory is a powerful tool for predicting market trends and understanding price cycles. Mastering these principles can refine your technical analysis and help you make smarter trading decisions.
🚀 Next Post:
📘 Mastering the Market: Core Elliott Wave Patterns You Need to Know
💬 Have questions? Leave a comment below!