❓ Want to predict market trends before they happen? ? The Elliott Wave Theory is a powerful price forecasting tool that helps traders identify high-probability setups in Forex, gold, and crypto markets. By mastering Elliott Wave patterns, traders can anticipate market reversals and catch major trends before they develop.
? Table of Contents
Want to learn how to apply Elliott Wave in real-time markets? ? Follow our live Elliott Wave market insights for practical applications.
- The Core Elliott Wave Rules Every Trader Must Know
- Understanding Elliott Wave Charts
- Free Elliott Wave Analysis Tools
- The Journey to Mastering Elliott Wave
Whether you’re a seasoned investor or just starting your trading journey, mastering Elliott Wave can significantly enhance your ability to interpret price movements and identify profitable opportunities.
In this article, we’ll explore the essential rules of Elliott Wave Theory, how to effectively read Elliott Wave charts, and where to find free analysis tools to refine your trading strategies.
The Core Elliott Wave Rules Every Trader Must Know
At its heart, Elliott Wave Theory is based on the idea that market movements follow repetitive patterns driven by crowd psychology. Understanding and applying the core rules of this theory can help traders predict potential price movements with greater accuracy. Here are the three fundamental rules:
- Wave 2 Never Retraces Beyond the Start of Wave 1
- Wave 2 typically corrects Wave 1 but cannot retrace 100% of it. If it does, the wave count is invalid.
- Wave 3 Is Never the Shortest Impulse Wave
- Wave 3 is often the most powerful and extended wave. While it doesn’t have to be the longest, it can’t be the shortest among Waves 1, 3, and 5.
- Wave 4 Never Overlaps Wave 1
- In an impulse wave, Wave 4 should not enter the price territory of Wave 1, except in cases involving diagonal triangles.
By adhering to these rules, traders can confidently identify valid wave patterns and avoid common misinterpretations.

Want to learn how to apply these rules to real charts? Check out our Live Elliott Wave Analysis for real-time setups!
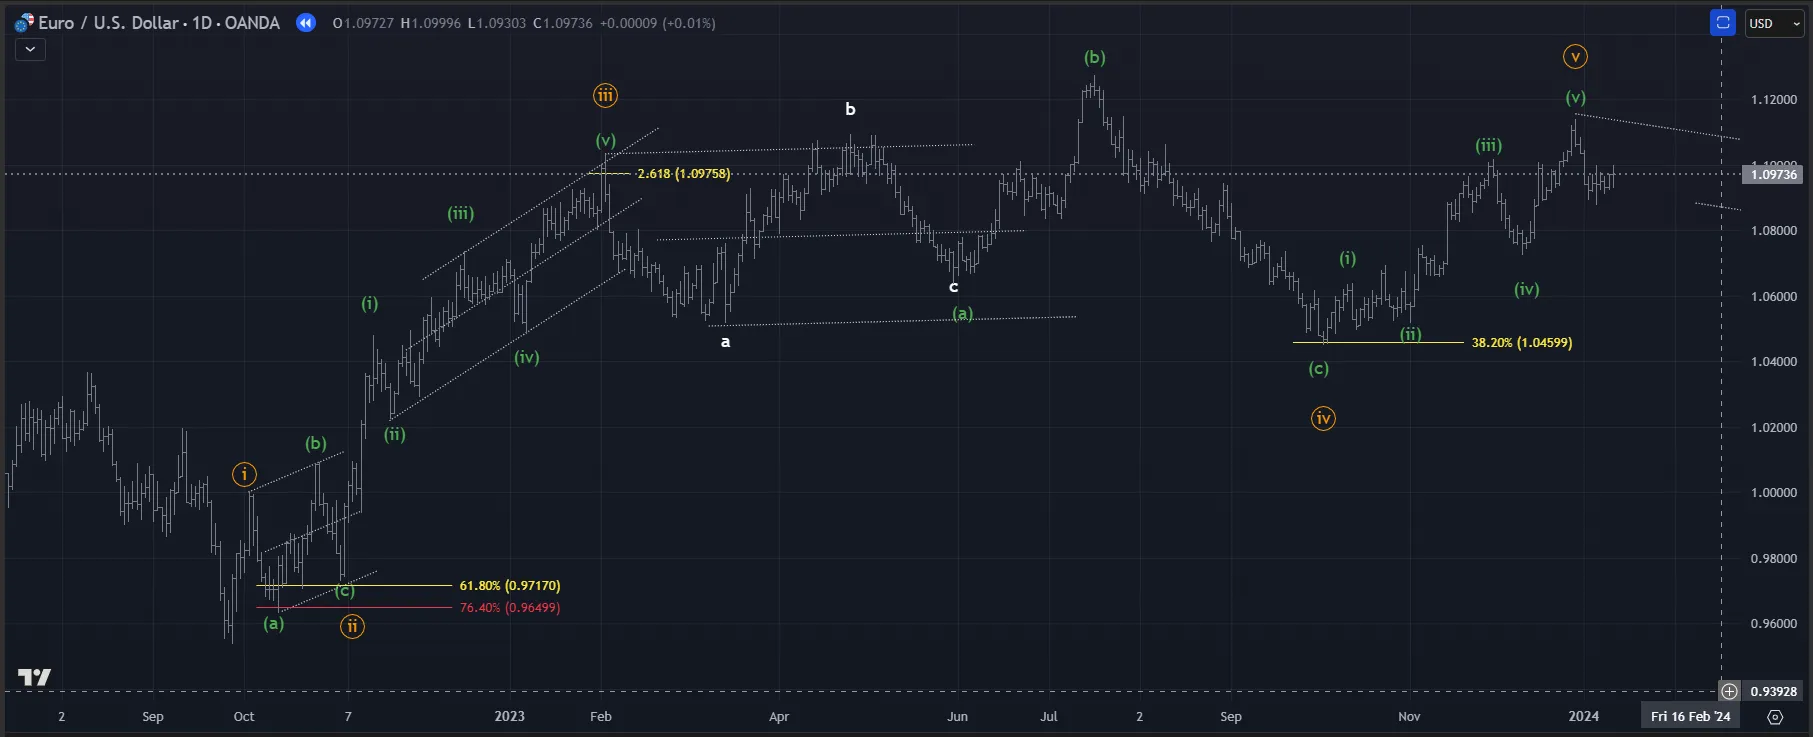
Understanding Elliott Wave Charts
Elliott Wave charts are invaluable tools for visualizing market structure and identifying trading opportunities. Here’s how to use them effectively:
- Spotting Impulse and Corrective Waves
- Impulse waves move in the direction of the larger trend and consist of five sub-waves (1, 2, 3, 4, 5). Corrective waves, on the other hand, move against the trend and are typically composed of three sub-waves (A, B, C).
- Using Fibonacci Ratios
- Fibonacci retracements and extensions are crucial for measuring potential price targets. For example, Wave 2 often retraces 50%-61.8% of Wave 1, while Wave 3 usually extends to 161.8% of Wave 1.
- Identifying Wave Degrees
- Elliott Wave Theory applies across multiple timeframes, with waves classified into different degrees. Practice analyzing charts on varying timeframes to refine your wave counts.
Charts are more than just a visual aid—they are a roadmap to understanding market psychology. By consistently practicing with Elliott Wave charts, traders can develop a clearer view of market trends.
? Stay Ahead of the Market
Join our community of traders who receive expert Elliott Wave forecasts every week.
? Get Free Weekly Elliott Wave Forecasts
Free Elliott Wave Analysis Tools
Access to reliable tools is critical for effectively applying Elliott Wave Theory. Fortunately, there are several free resources that can help:
- Trading Platforms
- Platforms like TradingView and MetaTrader offer built-in tools to draw and analyze Elliott Waves. Their charting capabilities are perfect for identifying wave patterns and applying Fibonacci tools.
- Elliott Wave Websites
- Websites like Elliott Wave Insights provide free analysis, educational materials, and market forecasts tailored to Elliott Wave Theory.
- Community Forums and Groups
- Join online communities where traders share their wave counts, analysis, and tips. Participating in these groups can enhance your learning and provide valuable insights.
By leveraging these tools, traders can enhance their analysis without incurring significant costs, making them especially useful for beginners.
The Journey to Mastering Elliott Wave
Becoming proficient in Elliott Wave Theory requires time, practice, and continuous learning. Here are some actionable steps to help you progress:
- Study the Classics
Books like Elliott Wave Principle: Key to Market Behavior by Robert Prechter and A.J. Frost or Mastering Elliott Wave by Glenn Neely are excellent starting points. - Practice Regularly
Apply wave counts to historical charts and current markets to build your confidence. - Combine with Other Tools
Enhance your wave analysis by incorporating indicators like RSI, MACD, and Fibonacci retracements. - Seek Feedback
Share your analyses with experienced traders or mentors to get constructive feedback and improve your accuracy.
Mastering Elliott Wave is not an overnight process, but with dedication and the right resources, it can become a cornerstone of your trading strategy.
? Ready to Master Elliott Wave?
Sign up now for free weekly insights and expert market analysis.
Conclusion
Elliott Wave Theory offers traders a powerful way to interpret market behavior and identify opportunities. By understanding the core rules, practicing with charts, and leveraging free analysis tools, traders can unlock the potential of this dynamic framework.
Whether you’re a beginner eager to learn the basics or an experienced trader refining your strategies, Elliott Wave Theory has something to offer. Start applying these principles today and take your trading to the next level.
? Share This Post
If you found this guide useful, share it with other traders! ?
? Share on Twitter
? Frequently Asked Questions (FAQs)
✅ Q: What is the best Elliott Wave indicator?
A: Most traders use a combination of Elliott Wave labels, Fibonacci retracements, and trend indicators such as RSI and MACD to confirm patterns.
✅ Q: How can I practice Elliott Wave analysis?
A: You can practice by analyzing historical charts and testing your wave counts using our real-time market insights.