Before
After

? Gold Hits $2,887 – What’s Next?
Gold has reached our projected resistance zone of $2,874 – $2,940, perfectly aligning with our Elliott Wave analysis. Now, the key question is:
? Will XAU/USD break past $2,940 toward $3,050?
? Or is a correction back to $2,740 in play?
? Key Price Levels to Watch
✅ Bullish Targets:
- $2,874 – $2,940 (Previously projected resistance)
- $3,000 – $3,050 (Next upside Fibonacci extension)
✅ Bearish Scenario:
- If $2,940 rejects price action, a correction could unfold.
- Support Levels:
- $2,740 (Previous breakout zone)
- $2,634 – $2,500 (Deeper correction levels)
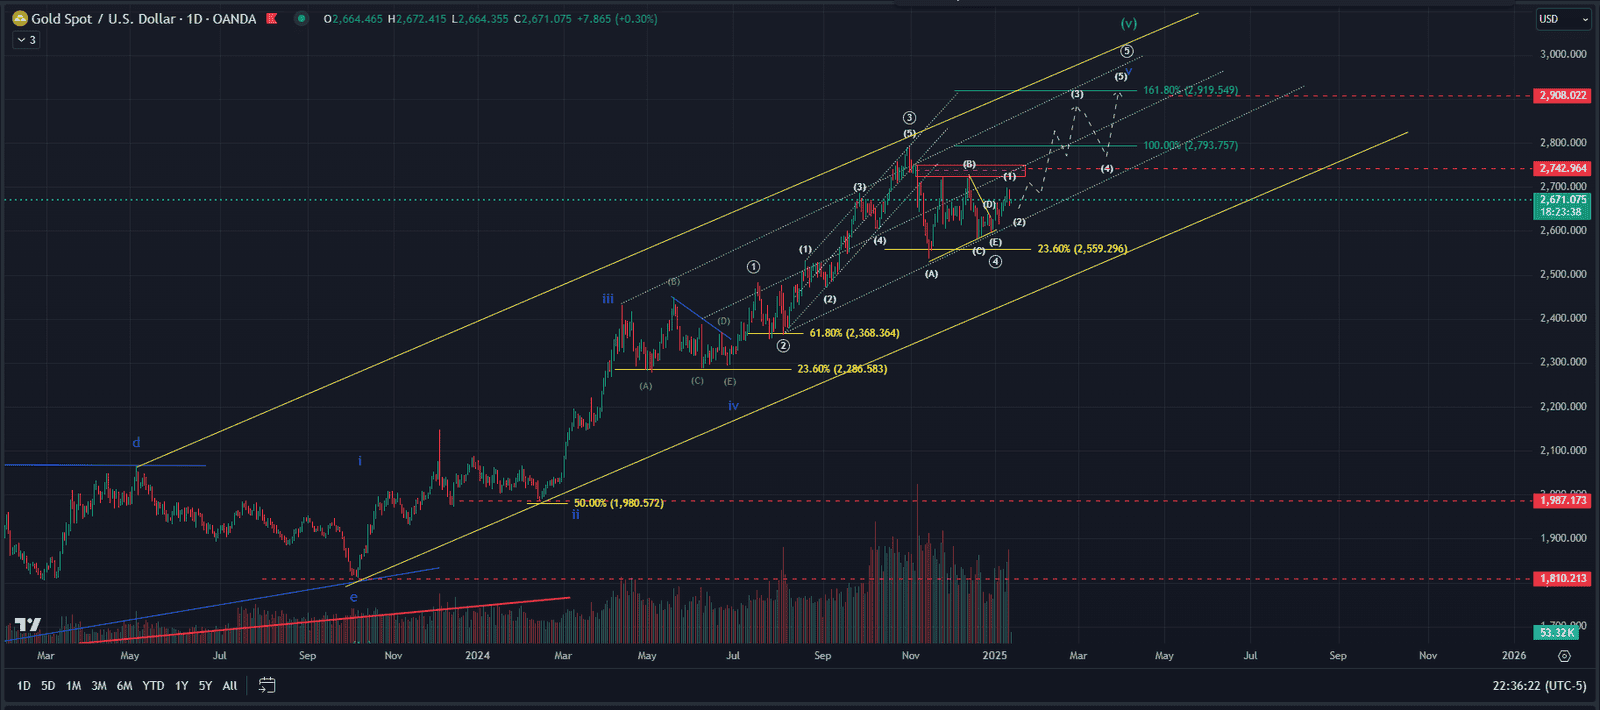
? Elliott Wave Breakdown: How We Got Here
- In our last analysis, we anticipated that Gold was in Wave (5) of an impulse.
- The latest price action confirms this bullish cycle, with Gold hitting $2,887, near the 161.8% Fibonacci extension of $2,905.
- RSI & MACD still show strength, but a slowdown at this level could signal a pending correction.
? Trading Strategy Considerations
? Bearish Approach (Shorting Gold)
- Look for a confirmed rejection at $2,940.
- A breakdown below $2,861 could signal weakness.
- Target $2,740, with an extended target at $2,500.
? Bullish Approach (Buying Gold)
- If $2,905 – $2,940 holds as support, the uptrend remains intact.
- A clean breakout above $2,940 could push toward $3,050.
- Watch for consolidation above $2,861 as a confirmation.
? What’s Your Take? Drop a Comment Below!
Do you think Gold will break past $3,000, or is a correction due?
? Comment your predictions! ?
? Follow for More:
✅ Weekly Elliott Wave Reports
✅ Premium Trading Setups
✅ Market Updates on Forex, Gold & Crypto