📖 Introduction
Are you new to trading and looking for an edge in understanding market trends? 📊
Elliott Wave Theory is a powerful tool for identifying market cycles, impulse moves, and corrective waves. This guide will break down the core principles of Elliott Wave Theory in a simple, easy-to-follow format.
✔️ By the end of this guide, you’ll understand:
- 📈 The basic structure of Elliott Waves
- 🔍 How to identify impulse & corrective waves
- 🎯 How to apply Elliott Wave Theory to real trading scenarios

🌊 What is Elliott Wave Theory?
Elliott Wave Theory is a technical analysis method that helps traders predict market trends by identifying recurring wave patterns.
🔍 Developed by Ralph Nelson Elliott in the 1930s, this theory suggests that market moves in waves, influenced by market sentiment and trader psychology.
The two types of waves are:
- 📈 Impulse Waves: Move with the trend
- 🔄 Corrective Waves: Move against the trend
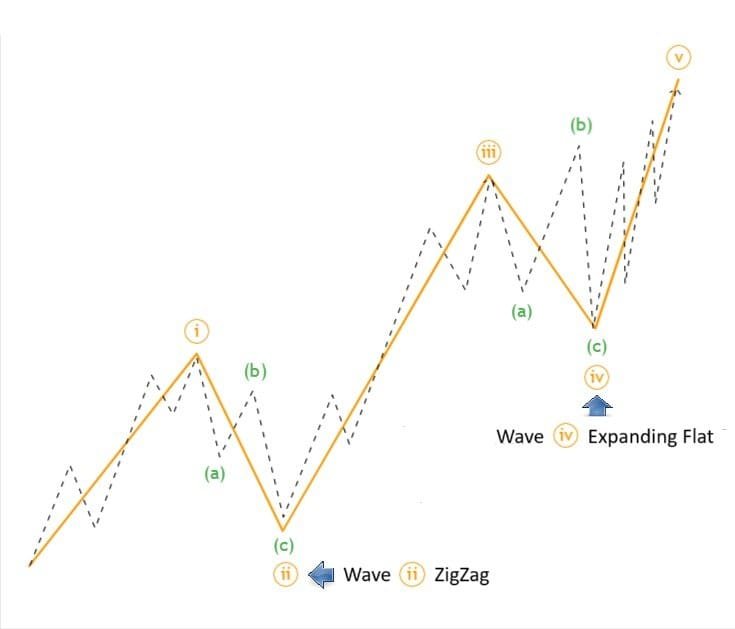
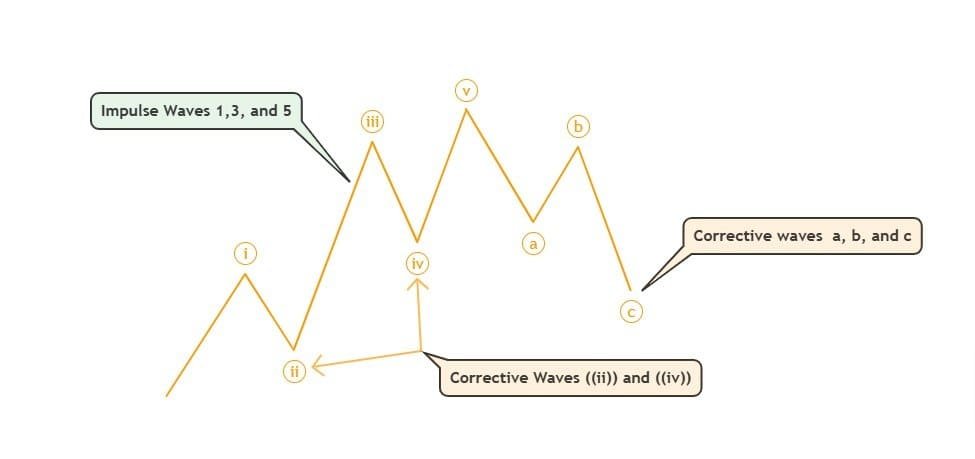
📊 The Basic Structure of Elliott Waves
The Elliott Wave pattern consists of two main phases:
🔥 1. Impulse Waves (Trending Moves)
Impulse waves move in the direction of the main trend and consist of 5 distinct waves:
- Wave 1: Initial price movement in the trend direction.
- Wave 2: Minor correction (does not extend beyond Wave 1).
- Wave 3: Strongest and longest wave (often the most profitable).
- Wave 4: Consolidation phase (usually retraces 38.2% of Wave 3).
- Wave 5: Final push before a larger correction.
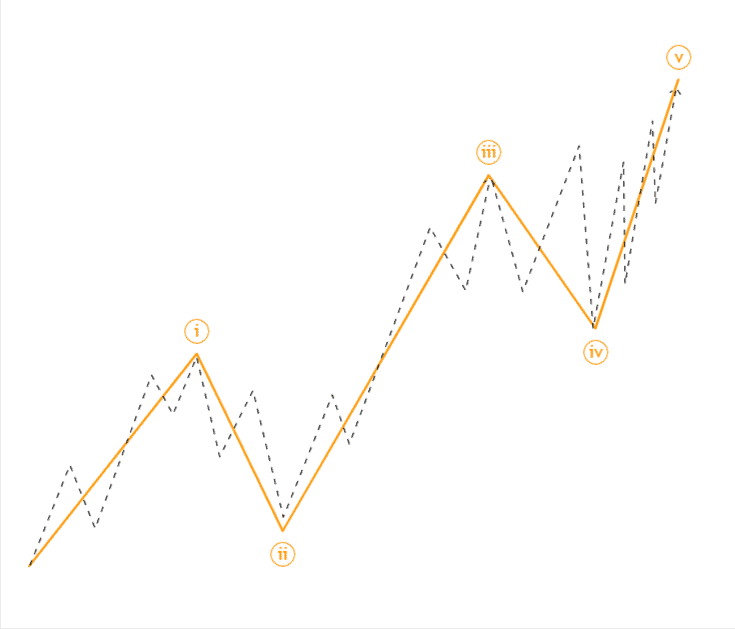
📊 Pro Tip: Wave 3 is usually the longest and most powerful wave.
🔄 2. Corrective Waves (Counter-Trend Moves)
Corrective waves move against the trend and consist of 3 waves:
- Wave A: Initial move against the trend.
- Wave B: Temporary retracement.
- Wave C: Continuation of the correction.
🔄 Corrective waves often follow Zigzag (A-B-C), Flat, or Triangle structures..
🔍 Why Beginners Should Learn Elliott Wave Theory
Understanding Elliott Wave Theory helps traders:
✅ Identify market trends early
✅ Anticipate price corrections & reversals
✅ Improve trade timing and risk management
Even beginners can use Elliott Waves to make more structured, data-driven trading decisions.
⚙️ Applying Elliott Wave Theory to Trading
Here’s a simple 3-step process to start using Elliott Waves in your trading strategy:
1. Identify Waves Using a Charting Platform
Use tools like TradingView to label waves on price charts.
2. Combine With Fibonacci Retracements
- Wave 2 retraces: 50%, 61.8%, 78.6% of Wave 1
- Wave 3 extends: 161.8%, 175%, or 261.8% of Wave 1
- Wave 4 retraces: 23.6% or 38.2% of Wave 3
3. Confirm With Technical Indicators
- RSI: Use for trend reversal signals.
- MACD: Apply crossover to confirm trend continuation.
🚩 Common Elliott Wave Mistakes to Avoid
❌ Forcing wave counts – If the structure doesn’t fit, don’t force it.
❌ Ignoring Wave Rules – Wave 3 must not be the shortest impulse wave.
❌ Misidentifying corrective patterns – A flat vs a zigzag can change trade direction.
❓ Frequently Asked Questions (FAQs)
Q: What is the best Elliott Wave indicator? Most traders use a combination of Elliott Wave labels, Fibonacci retracements, and RSI/MACD indicators to confirm patterns.
Q: How can I practice Elliott Wave analysis? You can analyse historical charts or test your wave counts using real-time market insights.
📊 Explore our [Live Elliott Wave Market Analysis] for real-time updates.
🏁 Final Thoughts & Next Steps
Mastering Elliott Wave Theory is a skill that improves over time. The more you practice, the better you become at identifying market trends and trade opportunities.
🚀 Want to dive deeper?
📝 Have questions? Leave a comment below!