🛢️ WTI Crude Oil – 4H Elliott Wave Projection
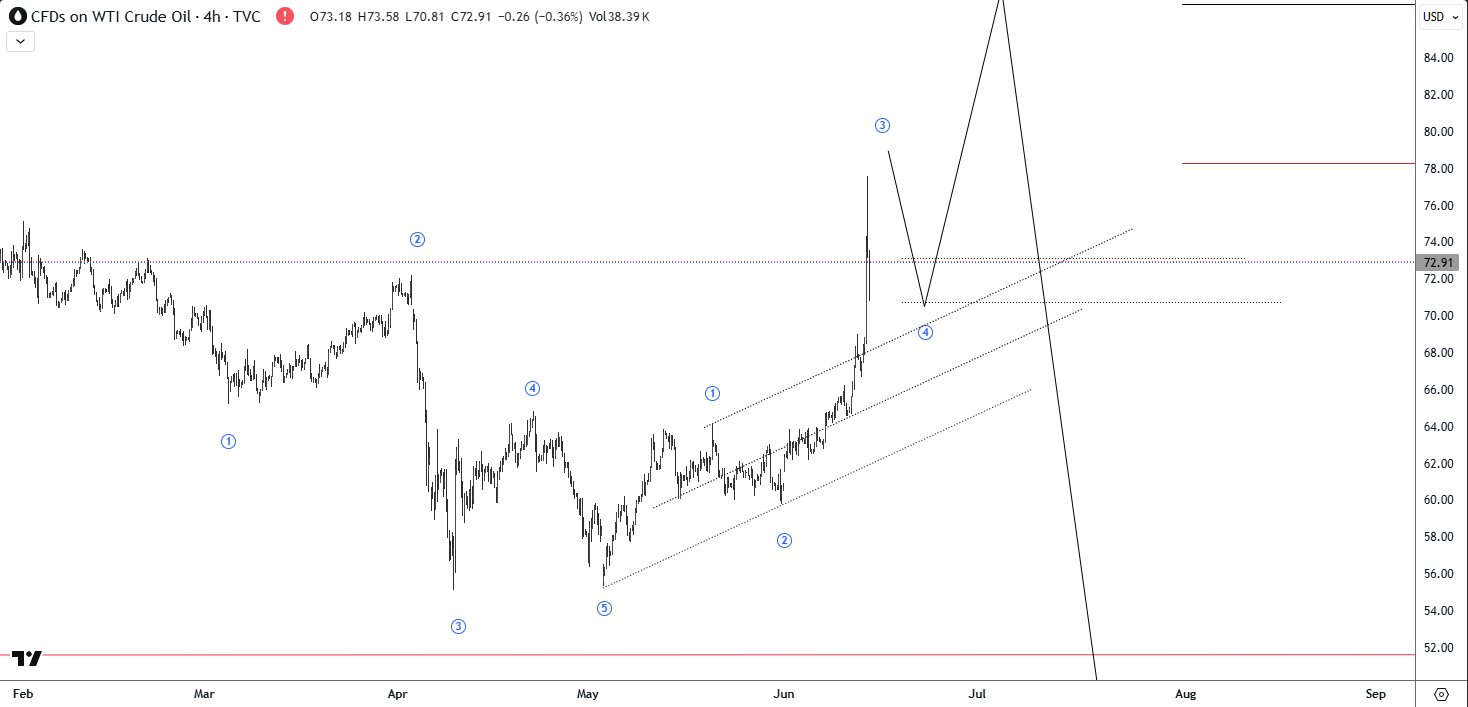
Posted: June 13, 2025 Crude Oil continues to advance within a developing impulsive wave structure, currently tracking wave 3 of a larger 5-wave sequence. After a parabolic rise, price may now enter a wave 4 pullback before the next leg higher unfolds. 🔍 Elliott Wave Structure ⚠️ Key Levels 🧭 Outlook