
3-Month Elliott Wave Chart Analysis
Summary
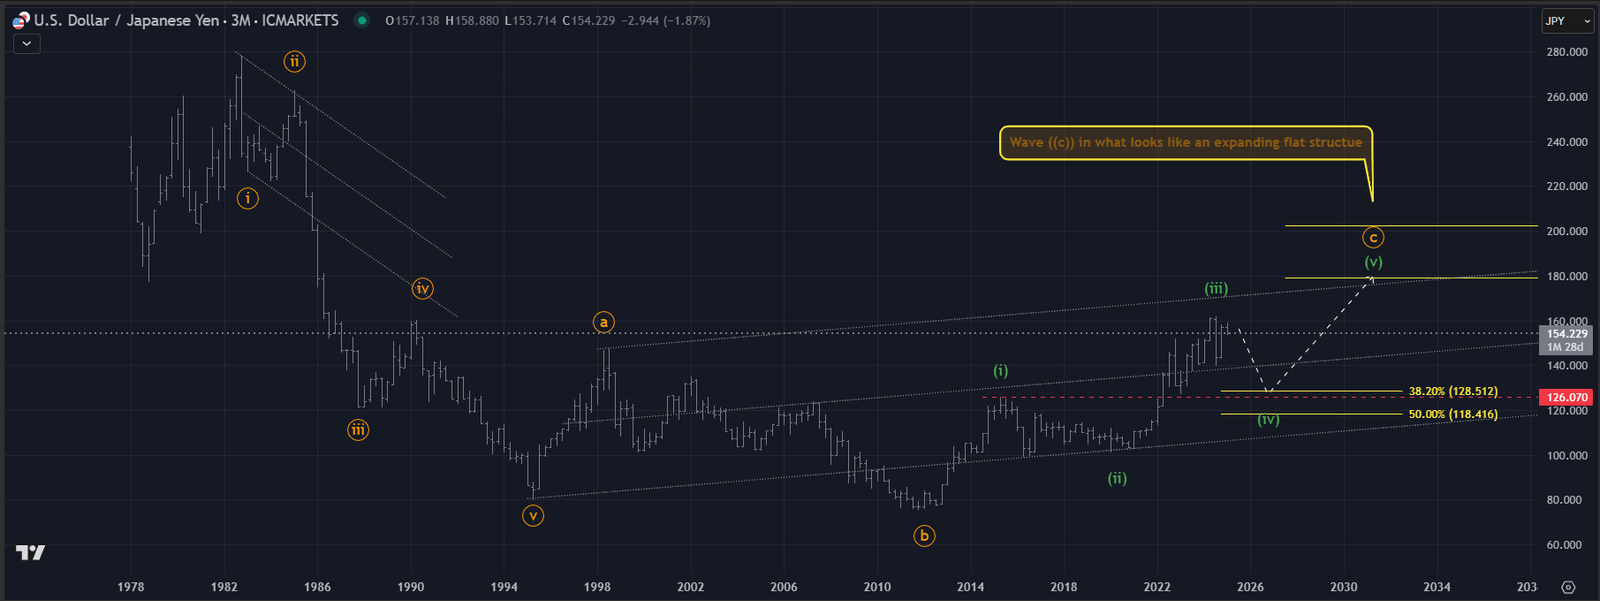
This Elliott Wave chart analysis suggests that USD/JPY remains in a long-term bullish trend, respecting an established base channel.
- The market appears to have completed a Wave ((iv)) correction, aligning with the 38.2% Fibonacci retracement (128.72).
- According to this Elliott Wave analysis, USD/JPY is likely beginning Wave ((v)), which is expected to unfold in a five-wave impulsive structure.
? Key Confirmation Levels
✔ Break above Wave ① high → Confirms bullish continuation toward 161.56 and 180.90.
❌ Drop below 128.72 → Invalidates the wave count, suggesting a larger correction.
? Projected Price Targets
- Near-Term Resistance: 149.62 (previous Wave ((iii)) high).
- Mid-Term Target: 161.56 (1.236 Fibonacci extension).
- Long-Term Extension: 180.90 (1.618 Fibonacci extension).
? Market Bias
✅ Bullish Outlook: As long as price remains above 141.39 – 128.72, the wave count remains valid.
? Bearish Risk: A drop below 128.72 could indicate a larger corrective structure before continuation.
? This Elliott Wave chart analysis highlights USD/JPY’s potential for further upside, with Wave ((v)) projected to extend toward 161.56 – 180.90, contingent on price maintaining support within key Fibonacci levels. on the price maintaining support within key Fibonacci levels.
USD/JPY Weekly Outlook – Elliott Wave Analysis
USD/JPY Weekly Outlook – Elliott Wave Analysis
Current Market Structure
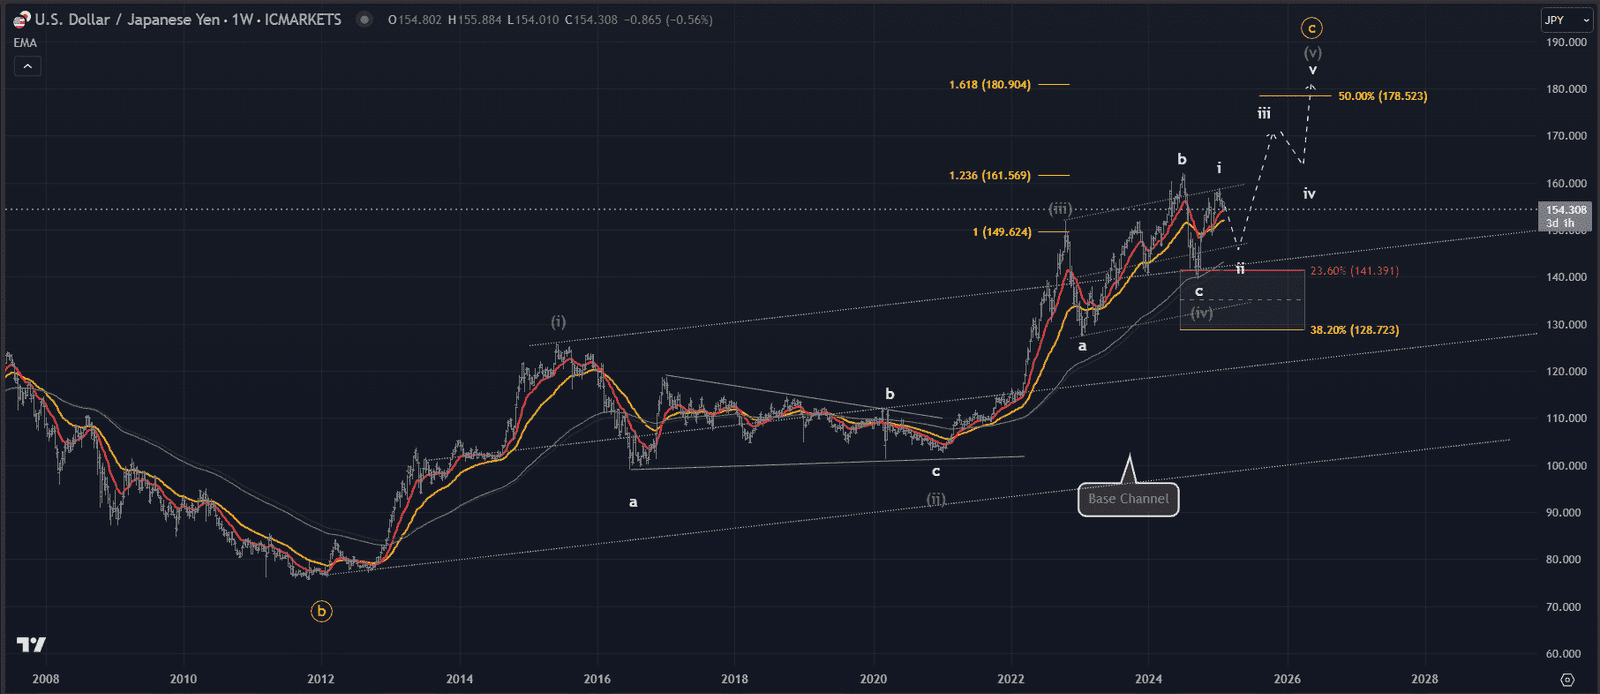
- This Elliott Wave analysis of USD/JPY suggests the market remains in a bullish long-term trend, respecting an established base channel.
- The chart highlights a completed Wave ((iv)) correction, setting the stage for the next leg higher.
- The expanding flat correction suggests Wave c found support near 128.72, aligning with Fibonacci confluence.
? Key Confirmation Levels
✔ Break above Wave ① high → Confirms the bullish structure and targets 161.56 – 180.90.
❌ Drop below 128.72 → Invalidates the bullish count and suggests a deeper correction.
? Potential Price Targets
- Near-Term Resistance: 149.62 (previous Wave ((iii)) high).
- Mid-Term Target: 161.56 (1.236 Fibonacci extension).
- Long-Term Extension: 180.90 (1.618 Fibonacci extension).
? Market Bias
✅ Bullish Outlook: As long as price remains above 141.39 – 128.72, this wave count remains valid.
? Deeper pullback below 128.72 could indicate a larger corrective structure before continuation.
? This Elliott Wave chart analysis suggests USD/JPY is in the early stages of Wave ((v)), with significant upside potential if the structure holds.
? Your Turn!
? What’s your outlook on USD/JPY? Do you think Wave ((v)) will reach 180.90?
Drop your thoughts in the comments below! ⬇️
? Want more Elliott Wave insights? Check out our latest Gold (XAU/USD) Elliott Wave Analysis and see how it correlates with USD/JPY.? Do you think Wave ((v)) will reach 180.90?
Drop your thoughts in the comments below! ⬇️