
Posted: June 13, 2025
The U.S. Dollar Index continues to unfold within a clean Elliott Wave structure following its sharp decline earlier this year. Here’s the current outlook based on the 4-hour chart:
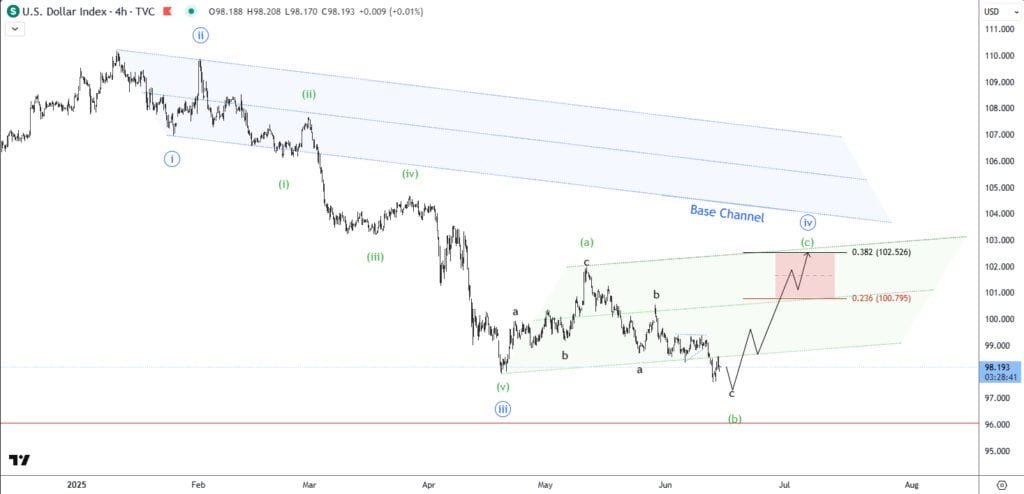
Wave (iv) correction in progress with a likely (a)-(b)-(c) structure.
Targeting the 0.382 retracement near 102.50 for wave (c), where supply and channel resistance align.
A rejection from this zone could set up wave (v) to resume the broader downtrend below 96.00.
🔍 Elliott Wave Count
The larger impulse from the March high appears to have completed as wave (iii), with price now developing a wave (iv) correction. Within this correction, we are tracking a likely (a)-(b)-(c) zigzag or flat scenario, where:
- Wave (a) topped near 101.60,
- Wave (b) bottomed near 97.00,
- A final push higher in wave (c) is now anticipated.
📐 Technical Levels & Structure
- Projected Wave (c) Target:
The 0.382 Fibonacci retracement of wave (iii), coming in at 102.527, marks a key resistance zone. This level also coincides with:- The upper boundary of the green corrective channel.
- A potential supply zone, highlighted in red.
- Base Channel:
The blue dotted base channel provides a larger bearish context — wave (iv) remains corrective as long as this boundary holds. - EMA Dynamics:
The EMA stack (orange, blue, and black) is compressing. A clean break above may support bullish momentum into the 102 zone.
⚠️ Risk & Invalidation
- A break below the 97.00 region (wave (b) low) would invalidate this bullish scenario and suggest wave (iv) already completed.
- A failure to push impulsively into 102.00–102.50 could signal early weakness in the rally.
🧭 Outlook
- Short-term bias: Bullish toward 102.00–102.50.
- Medium-term expectation: Bearish continuation in wave (v) once the correction completes — targeting levels below 96.00.
Let me know if you’d like:
- A matching SEO title/meta description
- A short caption for social sharing
- An updated version with SMC confluence or liquidity targets