🔍 Definition
A Corrective Wave is a price move that unfolds against the direction of the dominant trend. Unlike impulsive waves, corrections are typically slower, more complex, and serve to “correct” or retrace a portion of the prior move before the trend continues..
Corrective waves are often frustrating and deceptive, designed to shake out weak hands and create uncertainty before the next motive wave begins.
📉 Where Corrections Appear
Corrective waves most commonly occur:
- As Wave 2 (after Wave 1)
- As Wave 4 (after Wave 3)
- As Wave B within an A–B–C correction
- As X waves connecting complex patterns
Corrections never occur as Waves 1, 3, or 5, which are always motive.
🔄 Purpose of a Correction
Corrections serve three key market functions:
- Pause or retrace the previous impulsive move
- Consolidate gains/losses before the trend resumes
- Trap emotional traders during uncertainty and low momentum
⚙️ Corrective vs. Impulse: Key Differences
| Impulse Wave | Corrective Wave |
|---|---|
| Moves in direction of trend | Moves against the trend |
| Clear and directional | Choppy, overlapping, sideways |
| 5-wave structure (1-2-3-4-5) | 3-wave or complex structure |
| Easy to trade with trend | Harder to read and trade |
📌 Corrective Wave Structure
While there are many types, corrections generally follow a 3-wave pattern:
- A → B → C
Each leg of the correction may unfold with its own internal pattern:
- A: impulse or leading diagonal
- B: correction (zigzag, flat, triangle)
- C: impulse or ending diagonal
We’ll break down each correction type in the next lesson.
🧠 Summary
- Corrective waves move against the larger trend
- They tend to be slower, more complex, and frustrating
- Appear in Waves 2, 4, and B, and never as motive waves
- Most corrections begin with or reduce to an A–B–C structure, especially in simpler forms like zigzags and flats.
Would you like a simple chart graphic of a basic A–B–C correction (zigzag, flat, and triangle examples), or shall we continue to Lesson 2.2: Basic Corrective Patterns?
Basic Corrective Patterns
Corrective waves come in several shapes, but most fall into three classic categories:
🔸 Zigzag Overview (5–3–5 structure)
A zigzag is a sharp corrective pattern that moves strongly against the previous trend. It has a directional slope, unlike flats or triangles, and is composed of three waves:
- Wave A: 5-wave impulse or leading diagonal
- Wave B: 3-wave correction (typically shallow)
- Wave C: 5-wave impulse or ending diagonal
Structure:
5 – 3 – 5
Zigzags commonly appear in:
- Wave 2 (after Wave 1)
- Wave A (of an A–B–C correction)
- Wave W or Y in complex combinations
🔁 Zigzag Traits
- Wave B retraces 38.2%–61.8% of Wave A
- Wave C is often equal to A, or extends to 1.618 × A
- Zigzags appear fast, steep, and deceptive
- They differ from flats by having impulsive Waves A & C
✅ Zigzags give the illusion of trend continuation — then reverse aggressively.
🔄 Zigzag Variants
1. Single Zigzag
- The classic 5–3–5 structure
- Seen in simple corrections
2. Double Zigzag (W–X–Y)
- Two zigzags connected by an intervening Wave X
- Structure: (5–3–5) – X – (5–3–5)
- Appears when one zigzag isn’t sufficient to correct the previous impulse
3. Triple Zigzag (rare)
- Structure: W–X–Y–X–Z
- Extremely rare, seen in extended Wave B or Wave 4 corrections
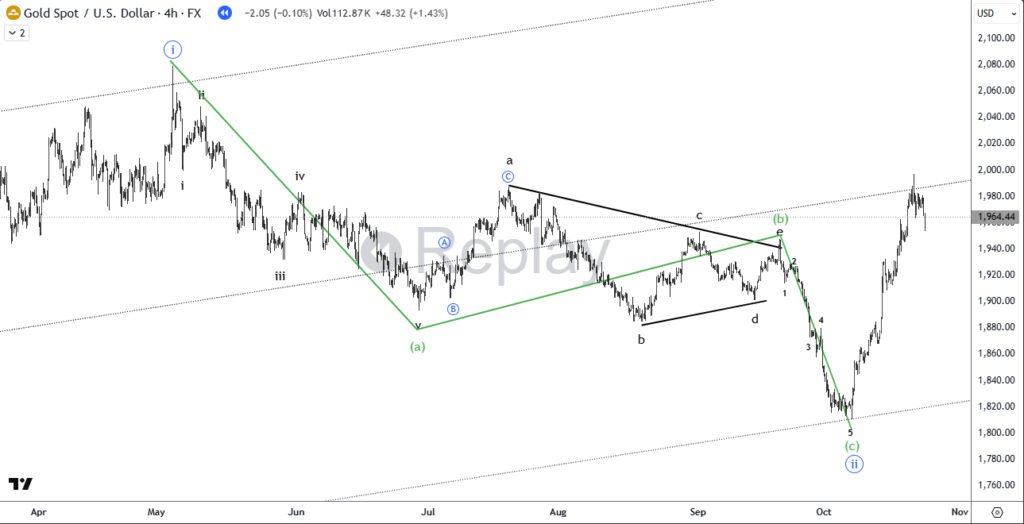
📈 Example: Zigzag Correction in Gold (Wave ii)
This chart shows a textbook zigzag correction forming Wave ii:
- Wave (a): Impulsive 5-wave decline
- Wave (b): Expanded triangle (ABCDE), a common form of B wave in zigzags
- Wave (c): Clean 5-wave impulse to finish the correction
🔍 Note how Wave B forms a complex triangle, which adds time but maintains the zigzag’s slope.
Wave C ends with a strong impulsive drop, completing Wave ii before trend continuation.
✅ Often resembles a miniature trend running counter to the main direction
🔶 Flat (3–3–5 structure)
A Flat correction is a sideways pattern made up of three waves:
- Wave A: 3 waves (corrective)
- Wave B: 3 waves (corrective)
- Wave C: 5 waves (impulse or diagonal)
Flats are common in Wave 4 and Wave B, and they tend to create choppy, range-bound movement.
🔁 Flat Types
- Regular Flat
- Wave B retraces close to the start of Wave A
- Wave C ends near or slightly beyond Wave A
- Expanded Flat
- Wave B exceeds the start of Wave A
- Wave C extends beyond the end of Wave A, often aggressively
- Very common and often traps breakout traders
- Running Flat (your chart example)
- Wave B exceeds the start of Wave A
- Wave C fails to reach the end of Wave A (truncated)
- Indicates a strong trend resuming quickly
✅ Flats often appear calm but are notorious for false signals and failed breakouts.
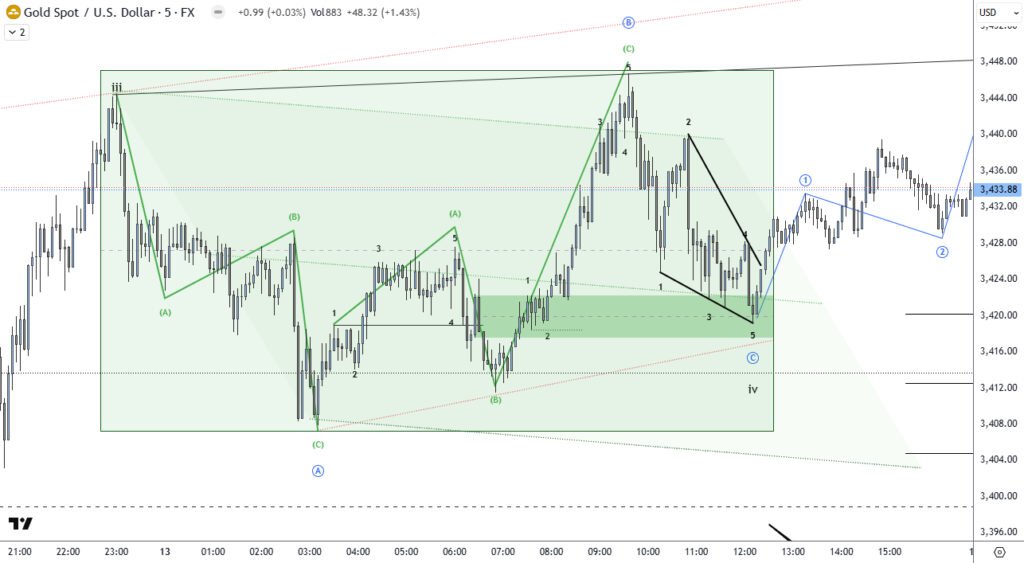
📈 Example: Running Flat in Gold
This chart shows a Running Flat correction within Wave (iv):
- Wave A: 3-wave drop (corrective)
- Wave B: Exceeds the start of Wave A (bull trap)
- Wave C: 5-wave decline that fails to break A’s low
This structure signals strength in the larger trend and often leads into a sharp impulsive continuation (Wave (v)).
📌 Wave B > A high, Wave C > A low = textbook Running Flat
Now that we’ve explored both sharp (zigzag) and sideways (flat) corrections — let’s look at the third major corrective category: Triangles.
🔺 Triangle (3–3–3–3–3 structure)
A triangle is a sideways corrective pattern made up of five overlapping legs labeled a–b–c–d–e. Each leg itself subdivides into three waves (A–B–C), forming a total of five 3-wave segments.
Triangles typically appear in:
- Wave 4
- Wave B
- Wave X (in complex corrections)
✅ Never in Wave 2 or 3
🧬 Structure Breakdown:
- 5 legs: a–b–c–d–e
- Each leg contains 3 subwaves: A–B–C
- Overall structure: 3–3–3–3–3
🧭 Triangle Types
- Symmetrical (most common)
→ Trendlines converge equally; price coils inward. - Ascending / Descending
→ One trendline is flat while the other slopes up/down; creates a rising or falling bias. - Expanding
→ Each leg gets larger; triangle widens over time. Often forms during volatile Wave 4 moves. 🔍 Seen in your chart example of Gold Wave (iv) - Running
→ Wave E ends beyond the start of Wave A. Seen during strong trends or when corrections are shallow.
✅ Triangles are most useful in identifying market compression. They typically form just before a decisive breakout resumes the main trend.
📈 Example: Expanding Triangle in Gold (Wave iv)
This chart shows a real-world expanding triangle with clearly labeled legs and subwaves:
- Each triangle leg (a–b–c–d–e) is made up of its own 3-wave A–B–C structure
- Wave E ends with a sharp reversal
- Wave (v) follows as a clean breakout
📌 Triangles are tricky but powerful — identifying the internal 3-wave structure of each leg is key to confirming the pattern.
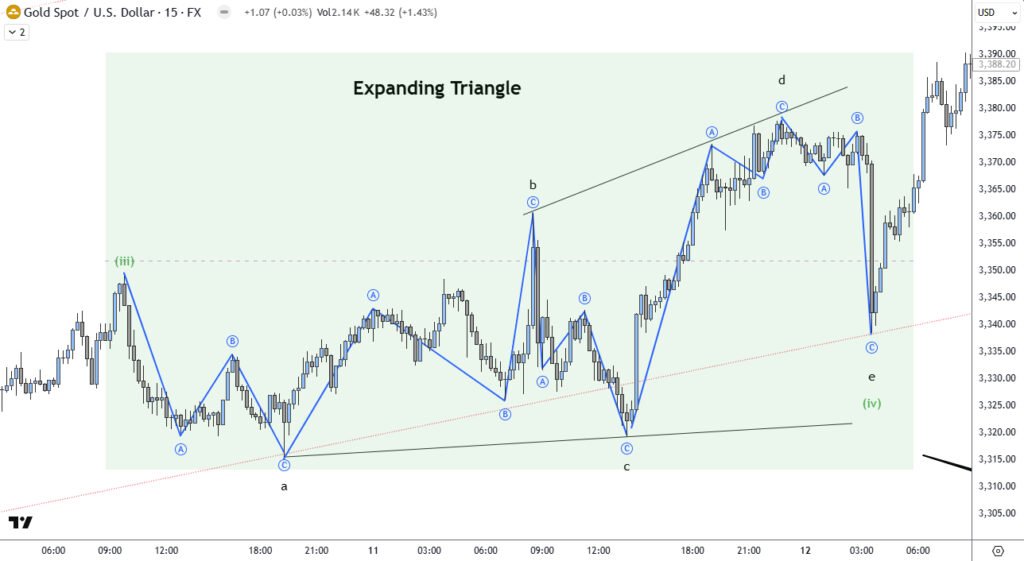
📈 Expanding Triangle Example with Subwaves (Gold – Wave iv)
This is a textbook expanding triangle in Gold (Wave iv), shown with internal structure highlighted:
- Each triangle leg (a–b–c–d–e) subdivides into a clear 3-wave move (A–B–C)
- The pattern forms after Wave (iii) and completes with a decisive breakout into Wave (v)
- Expanding triangles are rare but powerful — they often trap traders before a strong reversal
🔍 Always look for 3-wave subdivisions in each triangle leg — if a leg has 5 waves, it may be something else!
Triangles are defined by five 3-wave segments and often appear before the final move in a trend.
In this case, the breakout into Wave (v) confirms the structure.
💡 Chart Tip
Zigzags = deep & sharp
Flats = sideways traps
Triangles = coiled consolidations
🧠 Summary Table
| Pattern | Structure | Common Wave Location | Behavior |
|---|---|---|---|
| Zigzag | 5-3-5 | Wave 2, Wave A | Sharp, deep retracement |
| Flat | 3-3-5 | Wave 4, Wave B | Sideways, fakeouts |
| Triangle | 3-3-3-3-3 | Wave 4, B, or X | Contracting or sideways pause |