📖 Introduction
Forex trading requires a solid understanding of price charts to analyse market movements and make informed trading decisions. Whether you’re a beginner or an experienced trader, mastering chart types and patterns is crucial for technical analysis.
This guide covers:
- 📊 Different Types of Forex Charts (Line, Bar, Candlestick, and Renko)
- 🔍 How to Interpret Price Movements
- 📈 Chart Patterns & Trading Signals
🔢 1. Types of Forex Charts
Different chart types provide unique ways to visualize price movements.
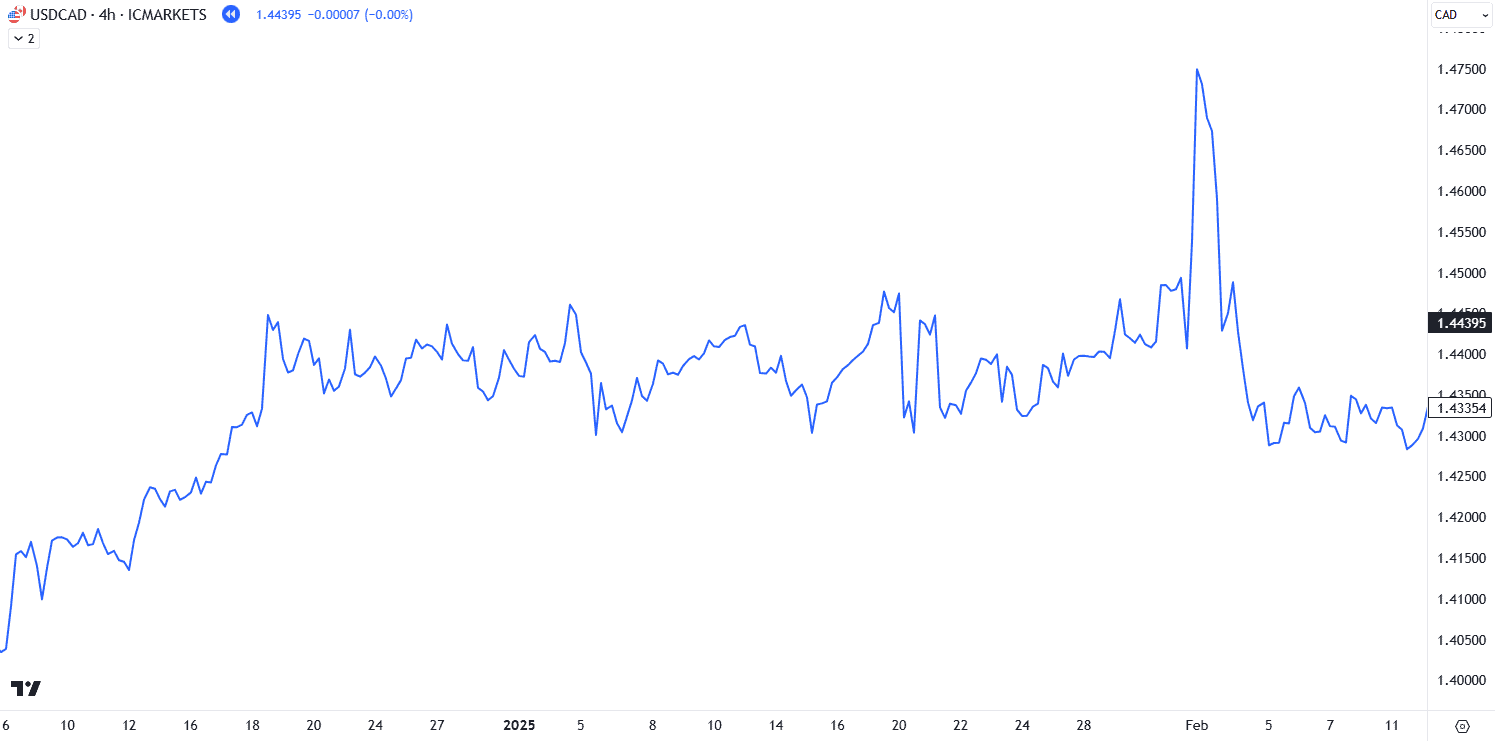
📉 Line Chart (Simple & Clear)
- Displays a single line connecting closing prices over time.
- Best for identifying long-term trends.
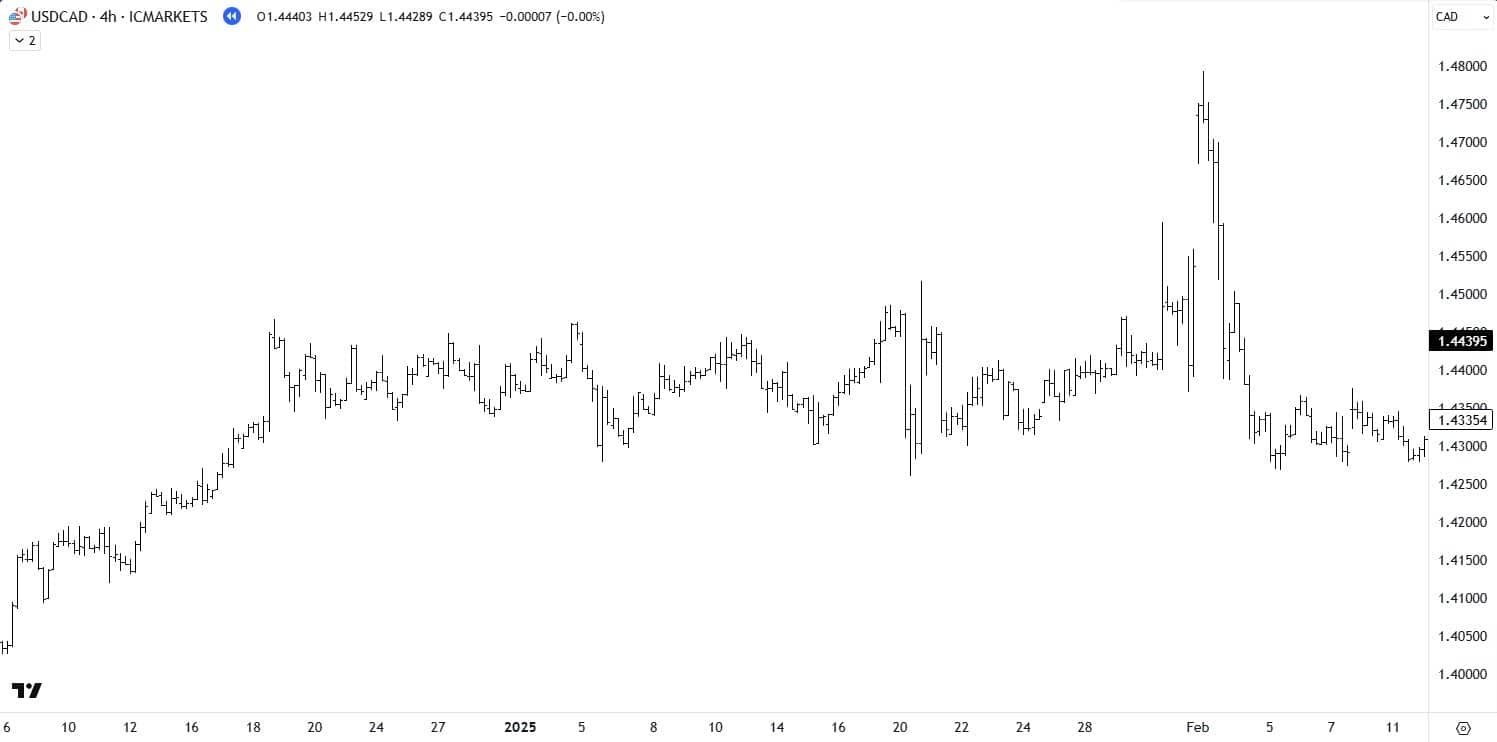
📊 Bar Chart (More Detailed)
- Shows open, high, low, and close prices (OHLC) for each time period.
- Each bar represents a trading session (hour, day, etc.).
- Provides more detail than a line chart but lacks visual candlestick patterns.
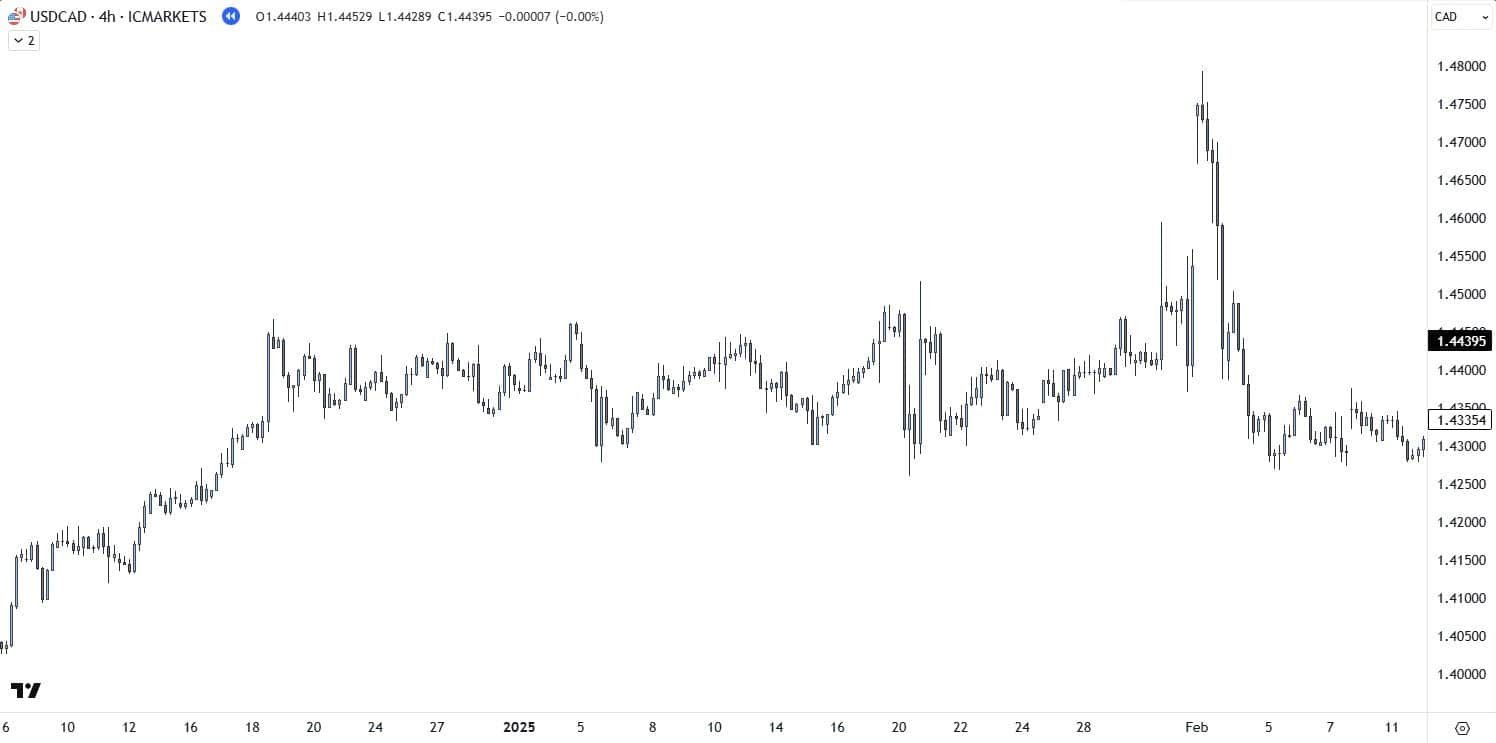
📈 Candlestick Chart (Most Popular & Widely Used)
- Each candlestick represents open, close, high, and low prices.
- Green (or white) candles = Bullish (price closed higher).
- Red (or black) candles = Bearish (price closed lower).
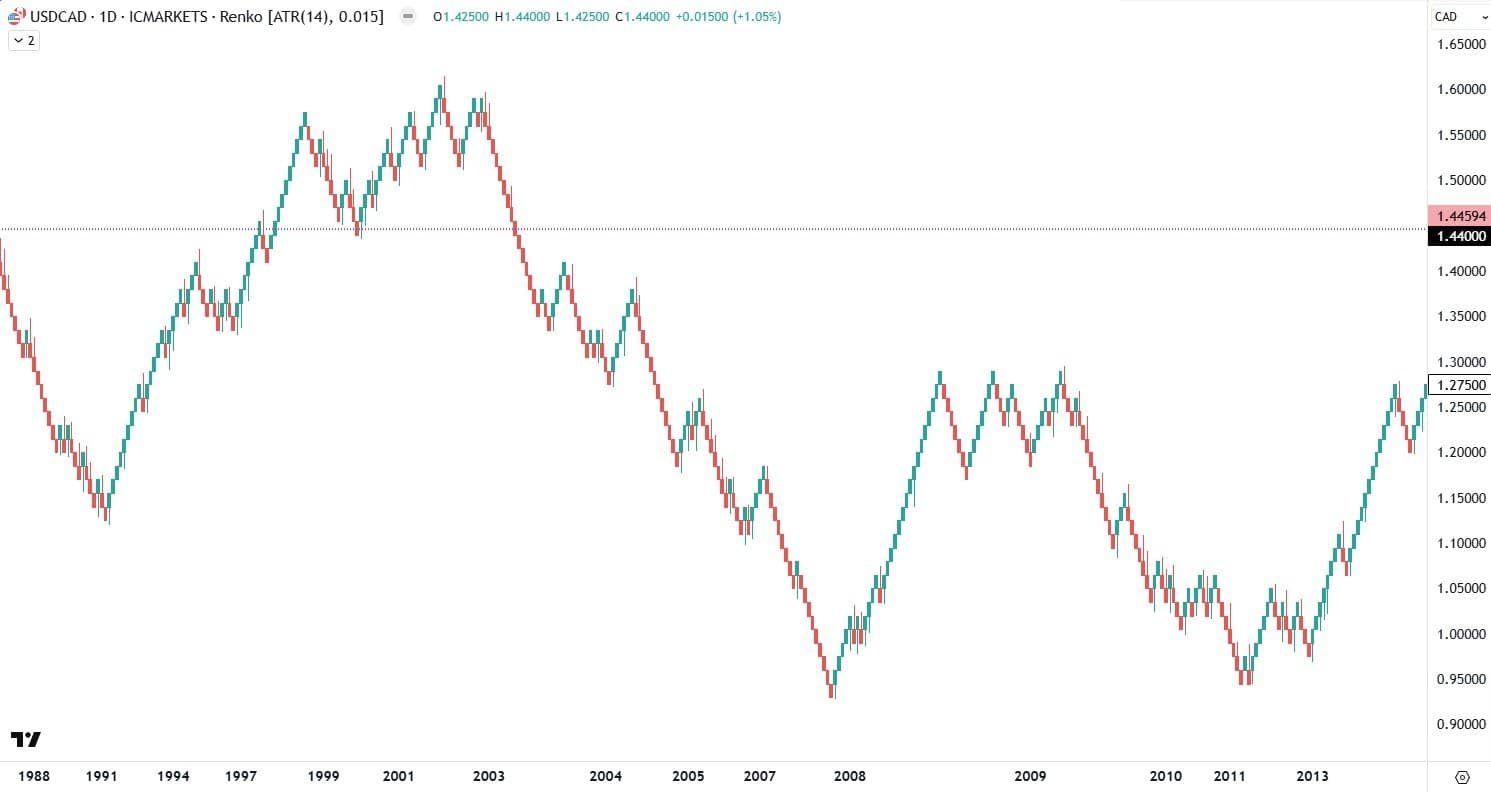
🔄 Renko Chart (Trend-Focused)
- Filters out market noise, showing only significant price movements.
- Best for identifying strong trends without small fluctuations.
🔍 2. How to Interpret Forex Charts
Once you understand chart types, interpreting price action is key.
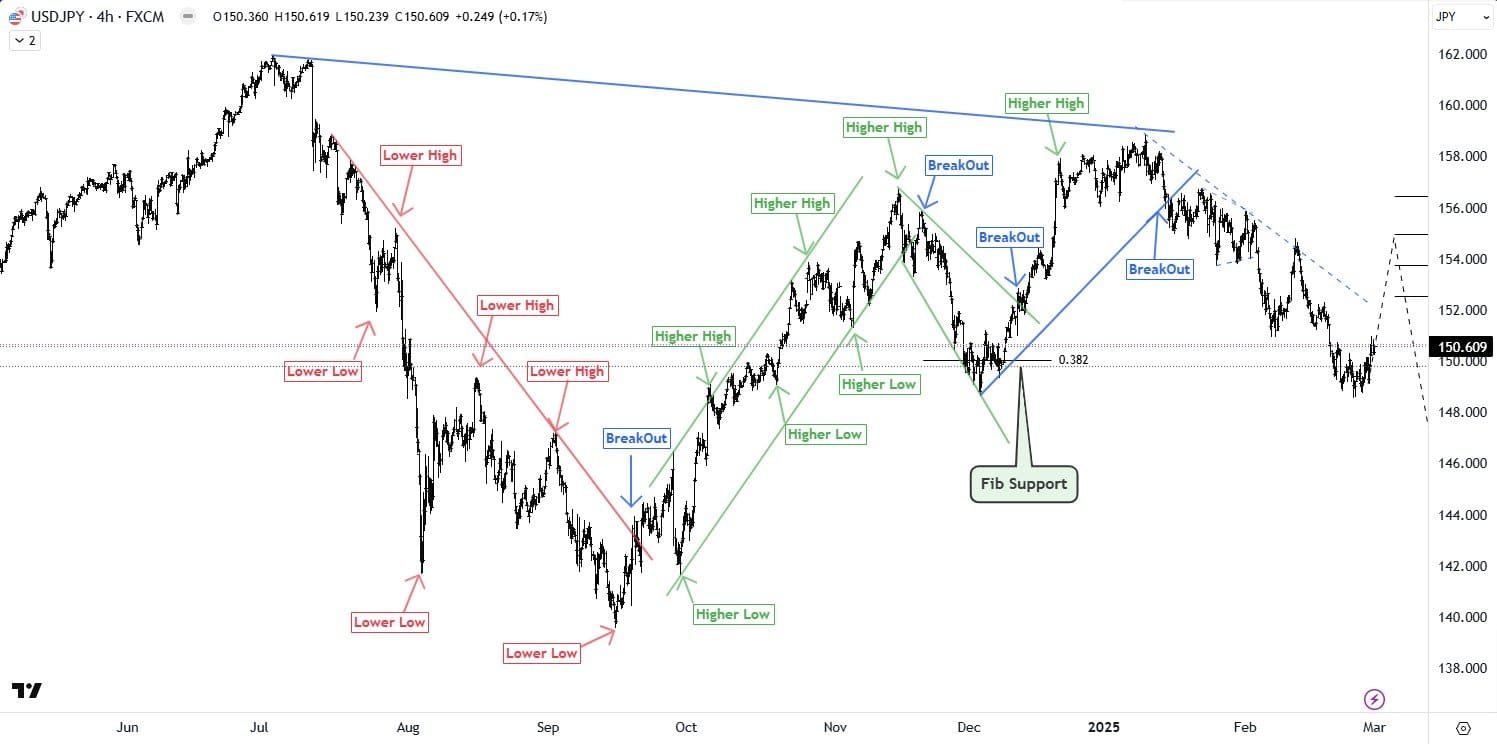
📏 Support & Resistance Levels
- Support: A price level where buying interest is strong.
- Resistance: A price level where selling interest is strong.
- Breakouts: When the price breaks through support or resistance levels.

📊 Trend Identification
- 🔼 Uptrend: Higher highs & higher lows.
- 🔽 Downtrend: Lower highs & lower lows.
- ➡️ Sideways Market: Price fluctuates in a range.
📈 3. Key Chart Patterns & Trading Signals
Chart patterns help traders predict market movements.
🔄 Reversal Patterns
- Head & Shoulders: Signals a potential trend reversal.
- Double Top/Bottom: Indicates strong resistance or support.
📐 Continuation Patterns
- Triangles (Ascending, Descending, Symmetrical): Price consolidates before continuing the trend.
- Flags & Pennants: Indicate strong momentum continuation.
📊 Image Suggestion: A trading pattern cheat sheet with common chart formations.
🛡️ 4. Setting Stop-Loss & Take-Profit
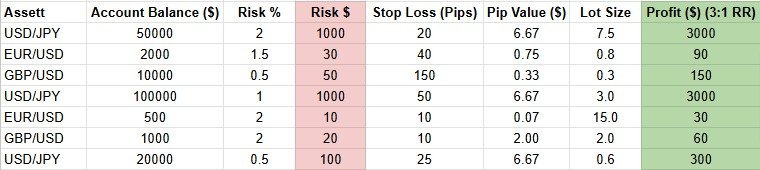
Risk management strategies rely on pip calculations and price levels for proper trade execution.
🚫 Stop-Loss Placement
- Set below support levels in an uptrend and above resistance levels in a downtrend.
- Use ATR (Average True Range) to determine optimal stop levels.
💰 Take-Profit Placement
- Set near major resistance in an uptrend and major support in a downtrend.
- Consider Risk-to-Reward Ratios (e.g., 1:2 or 1:3) for better trade management.
🎯 Conclusion
Understanding forex charts is essential for analysing price action, identifying trends, and making trading decisions. Mastering chart types, key patterns, and support/resistance will improve your technical analysis skills.
📘 Next Topic: Risk Management
Are you ready to master reading forex charts and enhance your trading strategy? 🚀