Posted: June 13, 2025
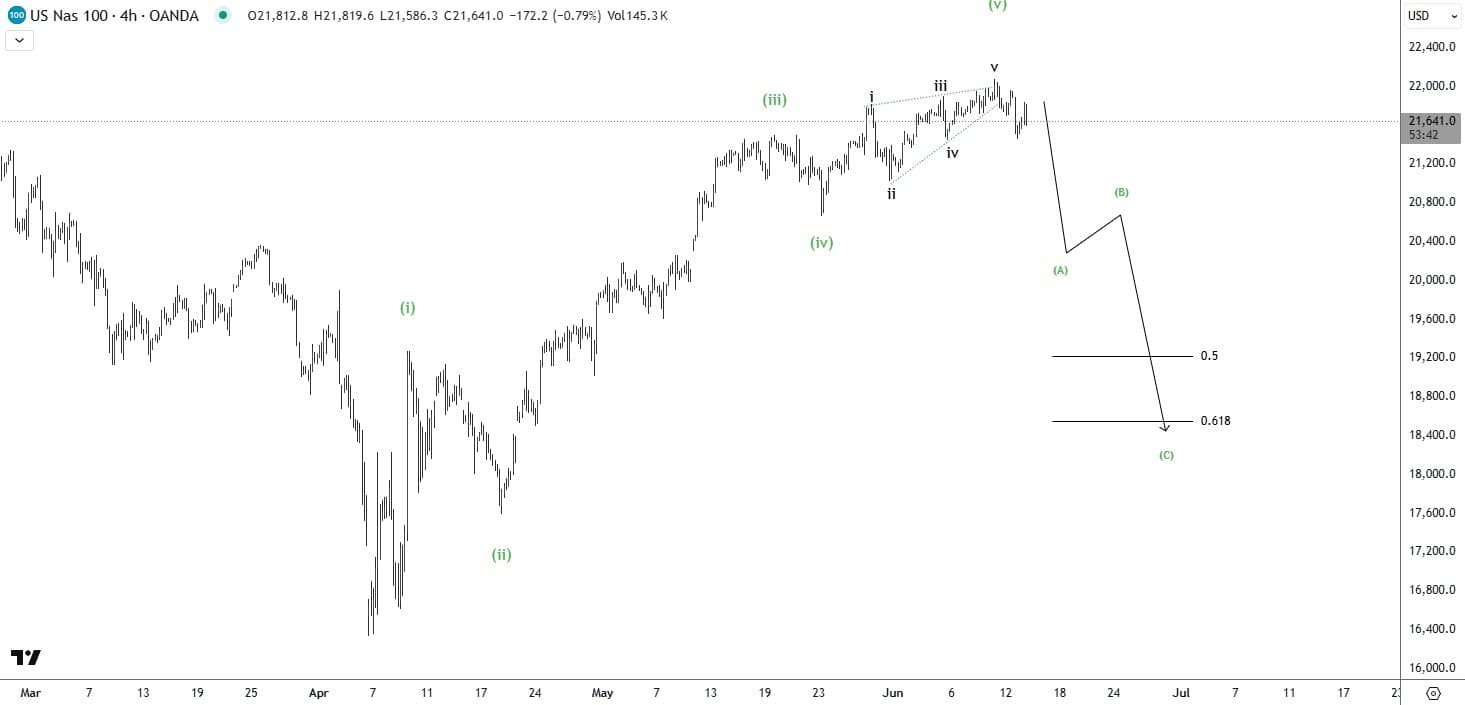
A clearer Elliott Wave count suggests that the NASDAQ 100 is currently unfolding wave (iv) within an ongoing impulse. The latest structure from the high resembles a classic A-B-C correction, targeting key fib retracements before wave (v) resumes.
Wave (iii) may be in at 21,800, with a corrective A-B-C now unfolding into wave (iv).
Looking for support near 21,000–20,200 before wave (v) resumes higher.
🧩 Updated Wave Count
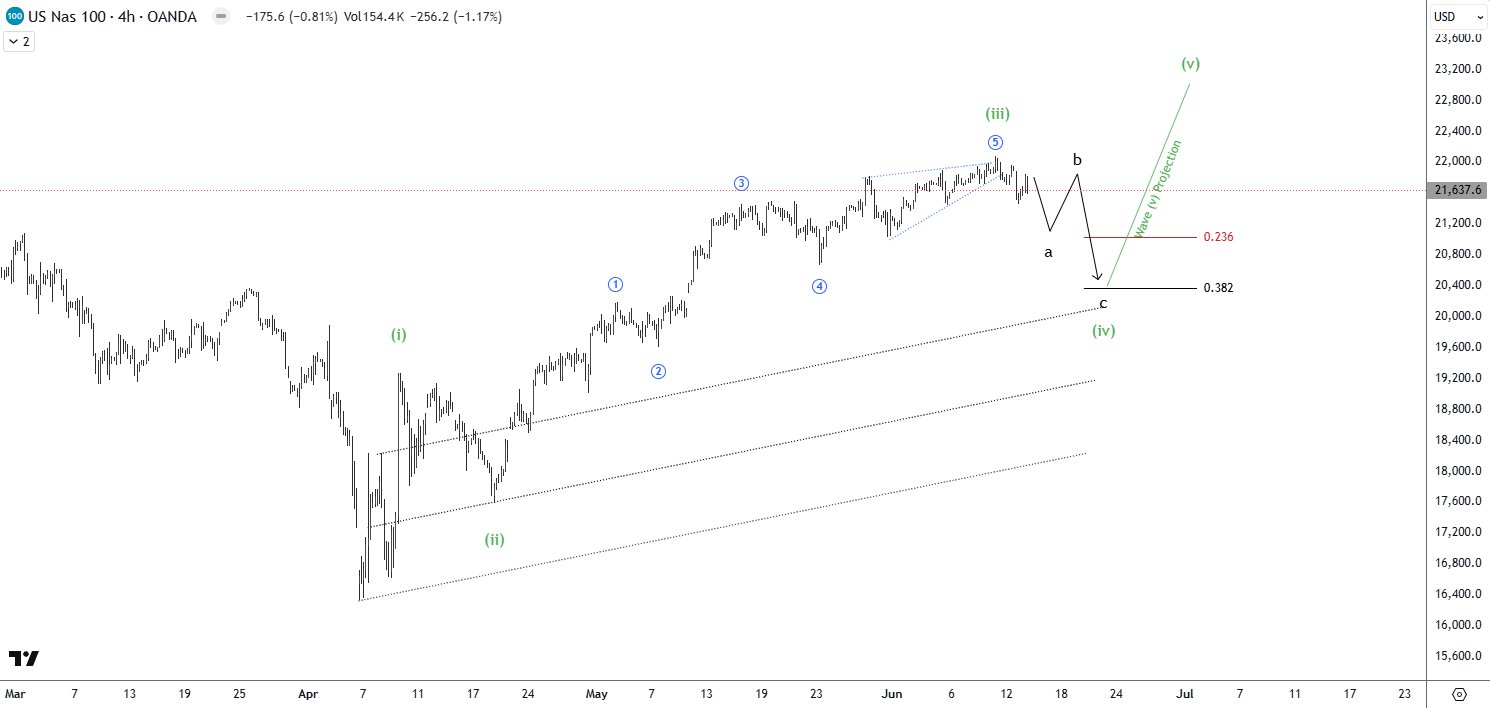
- The full impulse from the April low shows:
- Wave (i) and (ii) completed
- Wave (iii) peaked near 21,800
- Now in wave (iv): unfolding as a potential flat or zigzag
- The correction is targeting the 0.236–0.382 fib zone, around:
- 21,000 (0.236)
- 20,200 (0.382)
🧭 Projection
- Wave (v) is projected to extend beyond 22,000 once wave (iv) completes.
- The wave (iii) trendline may act as dynamic support if retested during wave (iv).
⚠️ Risk Levels
RSI and MACD also confirm temporary weakness but not reversal.
A breakdown below 20,000 would cast doubt on the impulse structure.